| Midway Physics Day Ride Analyses |
| Drop of Fear |
| Himalaya |
| Enterprise |
| Ferris Wheel |
| Rainbow |
| Starship 2000 |
| Swing Chairs |
| Wild Cat Roller Coaster |
| Home |
Fuerball
G. Robertson, D. Tedeschi
University of South Carolina
Introduction:
The "Fuerball," or, "Fireball," is a ride at the South Carolina State Fair that is a pendulum with a spinning set of chairs at its base. Having the chairs spin while the ride is also oscillating at points creates a feeling close to weightlessness and then at other points a feeling of forces over five times the gravity of Earth! The data taken from this ride was gathered with a triple axis accelerometer, a barometer and a CBL. The accelerometer has three axes: "x", "y" and "z." the x-axis points to the side of the rider and under normal circumstances, gives a reading of 0 m/s2. The y-axis points downward, parallel to the spine of the rider and would give a reading of 9.81 m/s2 off of the ride. The z-axis points towards the rider and away from the center of the ride; it normally reads 0 m/s 2.

The barometer was used to measure the air pressure during the ride. By taking a reference pressure (around 774 mm-Hg), subtracting it by the pressure measured, and then dividing that by the conversion of 0.0864 mm-Hg/m, the height of the rider could be calculated.

Ride Data:
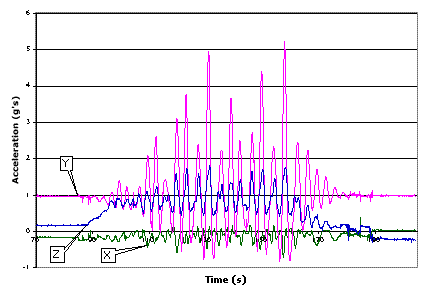
In the graph above, the accelerations from the three dimensional accelerometer for the ride, "Fuerball," are shown plotted against time. As shown by the graph, the accelerations in the y-direction are going to be greater than the rest because of the inherent swinging motion of the ride. The ride starts at about 78 seconds and immediately, as seen by the z-acceleration, the rider is pushed gradually into his seat; the spinning motion of the base causes this. Through the entire ride, this base spins and creates an average force of around 1 g. So, while the rider is being pushed into his seat with a force comparable to someone his own weight sitting on top of him, the ride is also swinging back and forth as shown by the y-acceleration.
The magnitude (r) of these accelerations can be found by:
![]()
The following graph shows the magnitude of these accelerations.

When these vectors are combined, it is seen that the rider never feels completely weightless during the ride, and in fact, at some points during the ride, the z-accelerations and the y-accelerations combine and create a force of about 5 and a half g's.
Height:
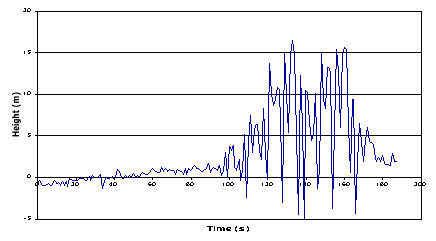
After the height was calculated from the barometer data, it was noticed that there was a trend in the data that caused the data to gradually increase.

In order to make the rest of the data more precise, a line was fitted to a section of the data that most matched a straight line as well as the trend itself. The equation for that line was found to be y=0.0223x-0.8769. When “x” was substituted with time, and the equation was subtracted from the data, this graph is produced:

In this graph there is not a noticeable trend in the data as in the previous graph.
Three-Dimensional Vector Analysis:
In three-dimensional space, vectors must be named using the angles, theta and phi, as well as Cartesian coordinates. From the accelerometer, it is possible to find these angles by these equations:

Of course, this gives an angle measured in radians, so to find the degree measurement, one would need to multiply the angle by (180/pi). The following graphs show the angle measurements for theta and phi in degrees.

Now, while these graphs are informative, they are not very helpful for visualization to the average person. In order to make the data more visually pleasing, the program Mathematica was used to create the following animation of the vector in three-dimensional space.