5 Electronic Measurements
Electronic instruments such as the CBL or Logger-Pro system can be used to perform specific physics measurements of the midway rides. While the sensor and recorder might be complicated, the measurement should be made as simple as possible to ensure easy to interpret results. Avoid rides where the direction of motion changes too often or too rapidly. Rides with constant circular motion or linear motion provide the cleanest measurements. See the Midway Physics Day web site for more examples.
· Circular Motion
Use the low-g accelerometer to measure centripetal forces. Compare with observations and mechanical measurements. Rides: Starship, Ferris Wheel, Magic Carpet (Rainbow), Merry-Go-Round.
· Linear Motion
Use low-g accelerometer to measure linear forces. Compare with observations and mechanical measurements. Rides: Drop of Fear, Roller Coaster, and Sack-slide.
· Collision
Use high-g accelerometer to measure forces in collisions on bumper car ride. Scale measurements up to highway speeds. Ride: Bumper Cars.
· 3D Motion
Use 3-D accelerometer to measure more complicated trajectories. Rides: Swing-chairs, Enterprise, G-Force.
· Multi-probe
Use both an accelerometer and barometer probes to get simultaneous data on the Drop of Fear, Roller Coaster, and Ferris Wheel to correlate accelerations with height.
5.1 The CBL and
Accelerometer System
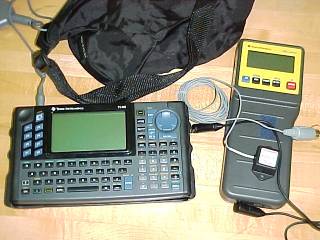
The CBL (shown above) is a portable data acquisition unit that connects to calculators for easy readout of data. A “single-axis, low-g” accelerometer attaches to the CBL to measure forces that give rise to accelerations between 0 and 5 times the acceleration due to gravity (5 g’s). The CBL and accelerometer fit in a waist pack for safe transport on the midway rides.
Each accelerometer has an arrow on it showing the axis of measurement. For example, it you point the arrow straight down towards the ground while standing still, the accelerometer will measure +1 g, the acceleration due to gravity. If you point it straight up, it will record –1 g. And finally, if you orient it horizontally, it records 0 g. (Why?)
In order to use the CBL to record accelerations, a data acquisition program must be loaded into the CBL from the calculator. These programs are available at the USC physics tent during the midway day for most types of TI calculator and CBL combination. Help setting up a CBL and calculator system is provided by the physics mentors.
The most important aspects of measuring the forces on rides are to position the axis in the proper direction, select the appropriate sampling time, and to select an appropriate number of samples. Watch the ride in action and decide in what direction you wish to measure the force. Also estimate the time of the ride to select the time interval. For example, to measure the centripetal force of a circular ride, point the arrow of the accelerometer along the radius of the circular motion.
5.2 Sample Analysis – The
Drop of Fear
The “Drop of Fear” is a free-fall ride. Riders are strapped in a car that is attached to rails on a large vertical tower. The car is then elevated to the top of the tower and “dropped”. During the descent, the riders experience “free-fall” before the car is braked to a halt near the bottom of the tower.
The data shown is the graph we collected using the CBL and low-g accelerometer. The arrow on the accelerometer was pointed downward. The constant acceleration at the beginning and end of the ride is when the riders are stationary in the car before and after the “drop”. Notice that during the drop (between 3-5 seconds) the riders feel no acceleration – a term know as weightlessness. Also indicated on the graph is the large force (over 4 g’s at 5.5 s) needed to decelerate the ride after the free-fall.
Advanced Analysis
It is important to understand that the accelerometer data do not represent the net force F, but F + g, and to apply Newton’s laws accordingly. This should be apparent from the reading of 1g (9.8 m/s2) when the ride is stationary. If the riders are stationary, then there must be no net force. During free-fall, the riders are obviously accelerating (-1g). Additionally, even though the riders “feel” weightless, the earth is still pulling on them with a force equal to their weight (hence the acceleration).
To
draw more quantitative conclusions, the CBL data can be imported into a
spreadsheet program and analyzed. For example, the deviation from 1g at the beginning and end of the ride indicates that
the accelerometer axis was tilted about 35 degrees from the true vertical
direction. Also, the area under the curve during free-fall is equal to the area
under the curve during braking. This can be verified using the linear momentum-
impulse theorem ![]() and numerically integrating the data over the different time
intervals.
and numerically integrating the data over the different time
intervals.